

Reliable ETA’s (Estimated Time of Arrivals) are key for an optimized operational planning and supply chain process improvement, and getting them has been a challenge since the invention of – well, ever. Often, ocean carriers are blamed for providing unreliable ETA’s, leading to lots of manual tracking and employee time wasted. From our research however, a different story emerges.
Let’s use the following framework to grasp the concepts:
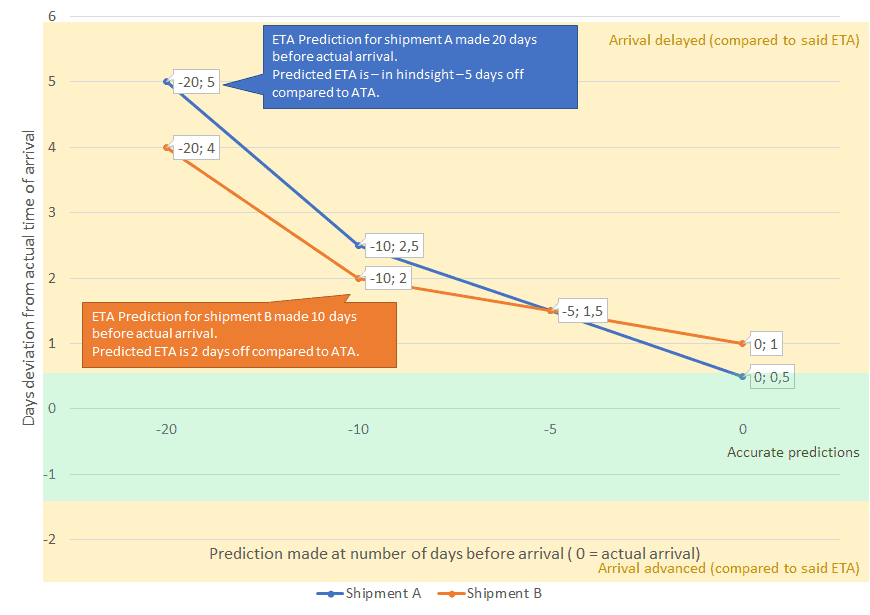
In the framework above, two shipments are displayed (A and B). Each data-point represents a predicted arrival. Predictions are made at different times throughout the journey: at the very beginning (left of x-axis, the departure), and more towards the arrival (right of x-axis, the arrival). All selected shipments have already arrived, so – with the benefit of hindsight – a comparison can be made between the prediction and the actual arrival. The deviation of this is shown on the y-axis.
In the example above, some expectations have been implemented:
- ETA’s become more accurate towards the end of the shipment (line will be adjoining horizontal 0 towards the end)
- Arrivals are typically predicted too be happening sooner than they actually are: delays are more occurring than advances (line is above the horizontal 0)
For a little bit more granularity, the x- and y-axes will be in hours instead of days.
That’s all you need to know to get started, let’s have a look at the data of 3500+ shipments.
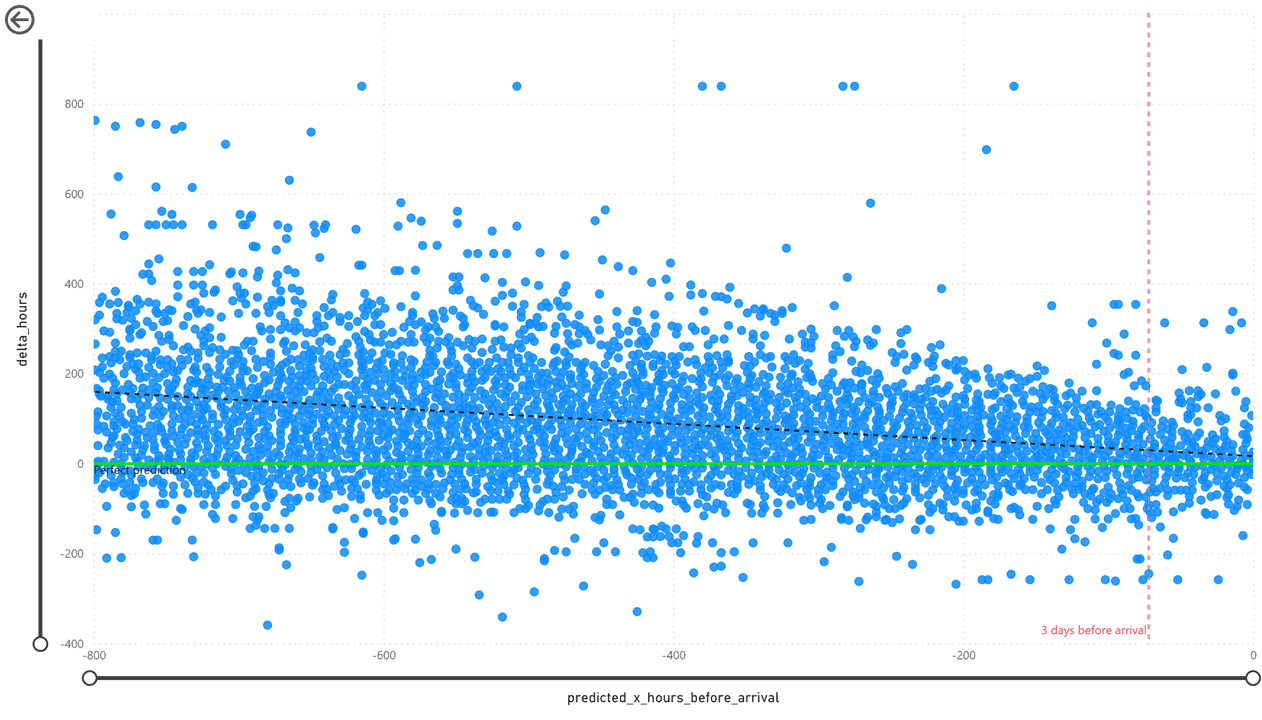
Well, that’s quite some data. As it turns out, on average 11 distinct ETA’s are predicted per shipment, with spikes up to 225 ETA’s for a single shipment.
Ideally all predictions would be around the green line. As would be expected however, the dots are generally above the ideal line, meaning carriers generally expect to be quicker than they actually are.
The data also shows support for the hypothesis that predictions become more accurate towards the end of the shipment.
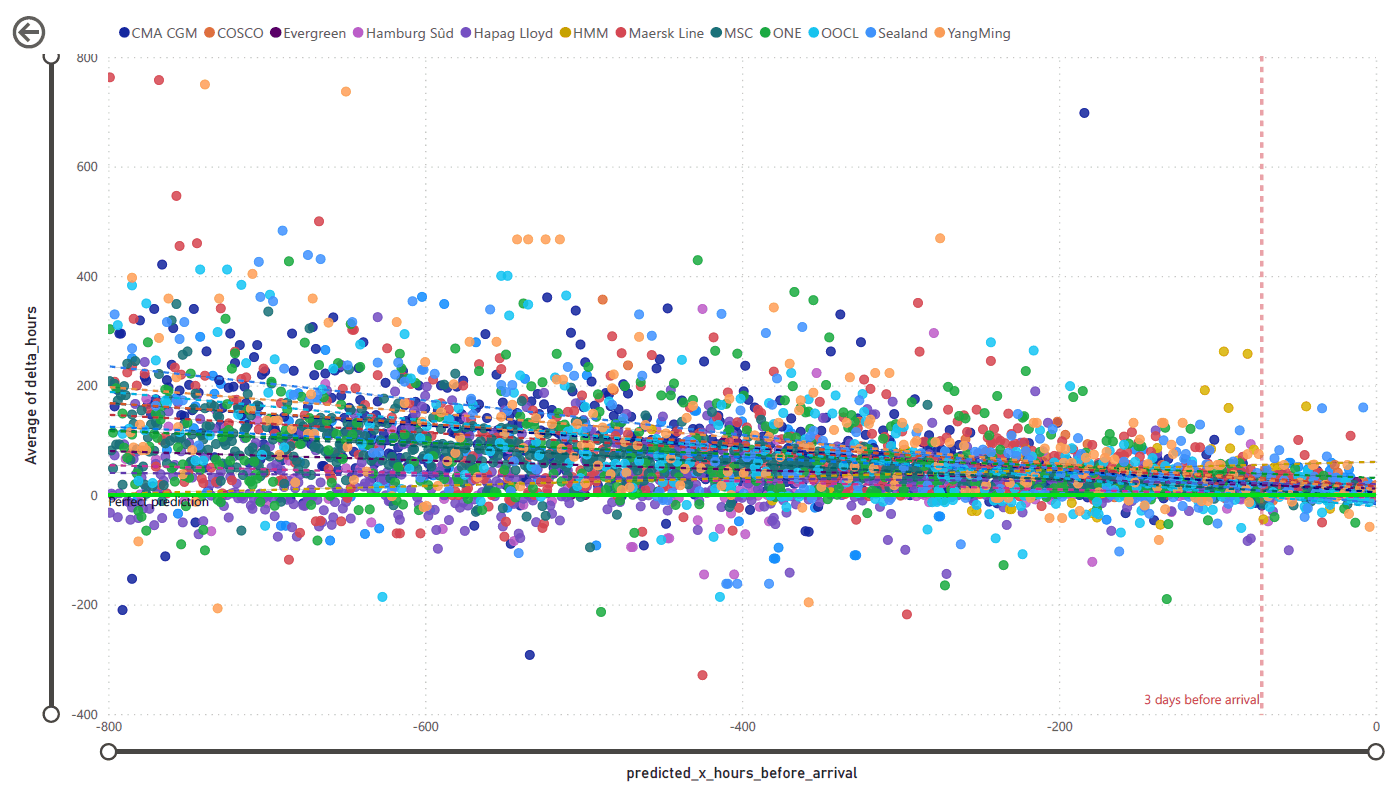
Difference across the carriers? Not so much. Looking at the image below, there is not much benefit to be expected by trusting some carrier’s data more than others. In the analysis below, deviations have been averaged per carrier. The trend-lines show a similar story in all cases.
Visually, this is more convincing when comparing some of the individual carriers side-by-side:
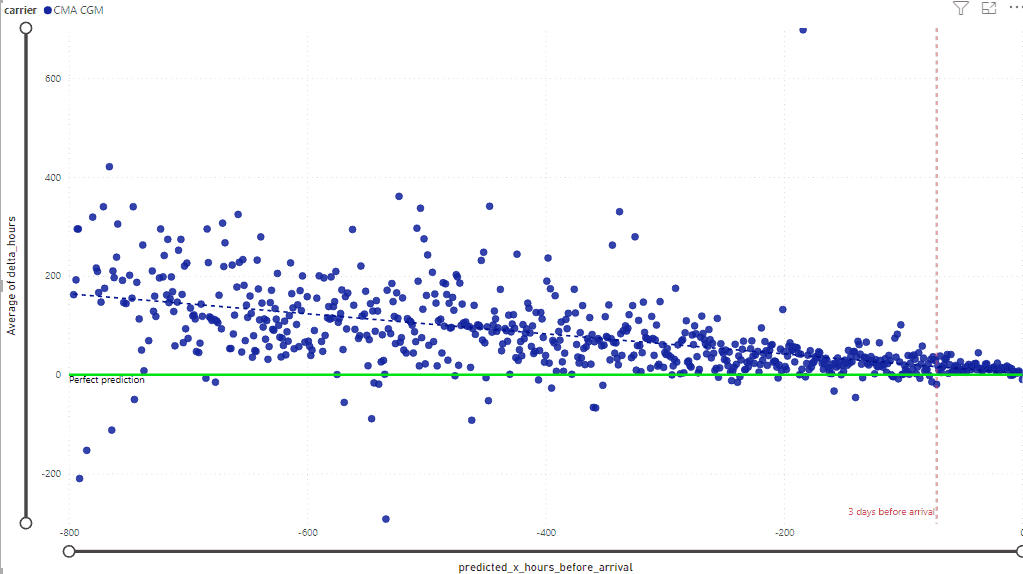
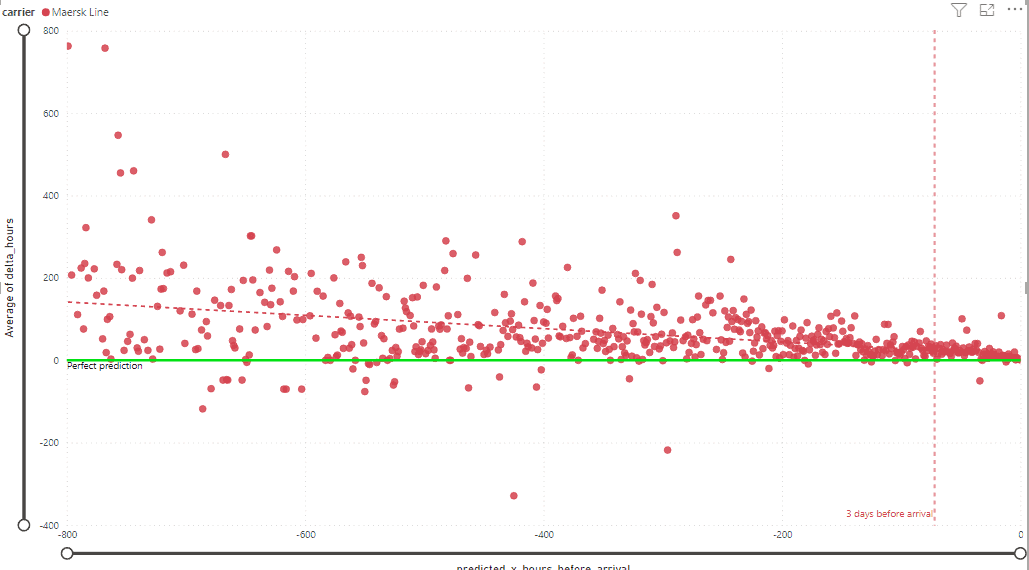
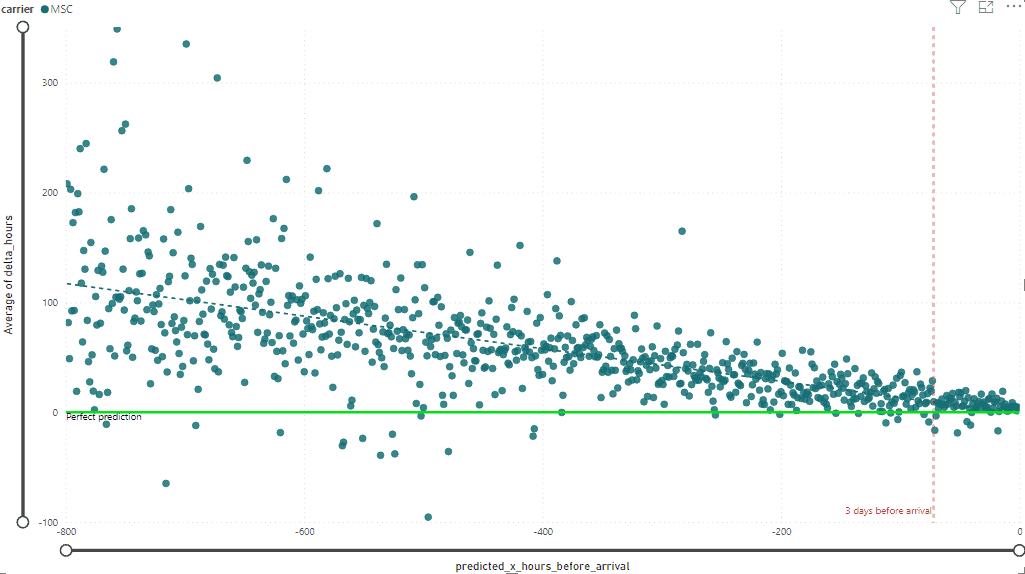
The data also reveals the cause for the general distrust in the carrier ETA’s: the deviations don’t decrease much relative to the time window to actual arrival. One would expect a narrow-down effect during the final hours before departure, but the data does not support such hypothesis. And it is exactly during these final days that the ETA becomes important to file import documents, book inland transport and plan the operational supply chain activities.

From this quick glance, the conclusion must be twofold. For tracking during a shipment journey, the ETA’s are updated often and relatively to the journey’s expected length, quite accurate. During the final hours before the arrival, it is beneficial to enhance this data with live location (AIS-data) from the vessel, so an optimal monitoring happens.
Happy shipping! Please feel free to inquire further about a specific port or carrier.
You can also book a 15-min meeting with me .
Download a sample of the data: data.xlsx
Michiel is Tech Lead at Dockflow.
Dockflow is the platform for saving time and costs in maritime logistics by automating boring and repetitive work.