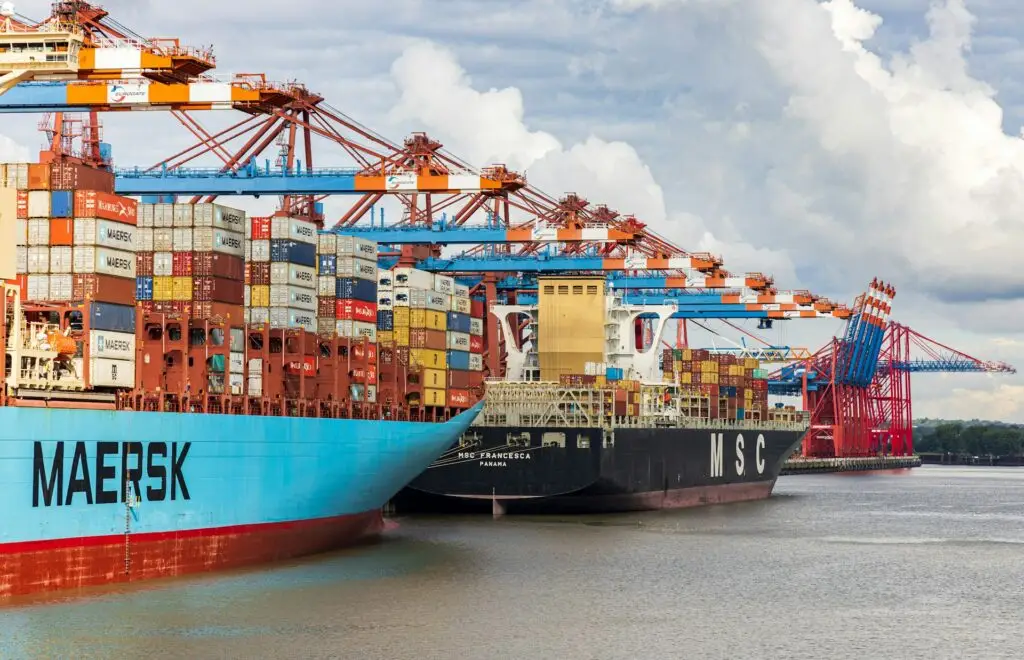

The Global Shipping Landscape
Maritime shipping is the engine of global trade, with nearly 6,000 container vessels delivering over $7 trillion in goods annually. When oil tankers and bulk carriers are included, there are roughly 100,000 vessels traversing the oceans at any given moment. The largest container ships now exceed 24,000 TEU, highlighting the sector’s scale and complexity.
But with this scale comes a carbon cost. Maritime shipping accounts for approximately 2.9% of global CO₂ emissions, powered predominantly by heavy fuel oil. The latter’s a high-emission, high-particulate energy source.
These emissions include not only CO₂ but also black soot and sulfates that have reached a level where they’re visible from space, imposing climate and air-quality challenges.
The Red Sea Crisis and Widespread Rerouting
Since October 2023, escalating Houthi defense operations in Yemen have jeopardized the safety of commercial shipping through the Suez Canal. By March 2024, over 2,000 vessels had been rerouted around the Cape of Good Hope, according to publicly tracked records.
This rerouting has introduced significant carbon consequences. For instance, a Shanghai-to-Hamburg voyage via the Cape emits 38% more CO₂ than the traditional Suez route, amounting to 4.32 million kg per journey. These rerouted trips add as much as 6,000 nautical miles and 20 extra days at sea, increasing fuel costs by up to $1 million per voyage.
The global ripple effects are staggering. Suez Canal traffic dropped by two-thirds, Bab-el-Mandeb traffic fell 59%, and traffic around the Cape of Good Hope surged 57%.
The CO₂ Burden of Container Rerouting
At a container level, the shift in routing adds up quickly. The original route emitted about 1.07 tons of CO₂ per container. On rerouted voyages, this figure jumps to 1.35 tons, a tremendous increase of 0.28 tons per container.
For a 10,000-container vessel, this equals 2,800 extra tons of CO₂, a carbon volume that literally dwarfs the Statue of Liberty. To put it in perspective, a typical passenger car emits 4.6 tons of CO₂ per year. That means a single rerouted vessel releases as much CO₂ as 600+ cars in just one voyage.
Between December 2023 and March 2024, emissions and transit times spiked by ~50% for over 6,000 analyzed containers. According to new data from myKN, the per-container CO₂ increase sits at 26%.
From mid-December 2023 to mid-April 2024, an estimated 13.6 million additional tonnes of CO₂ were emitted due to rerouting. This is the equivalent of emissions from 9 million cars! If the current trend continues, 41 million extra tonnes of CO₂ could be added annually.
Macroscale Emissions Surge
These changes are shifting the macroscale emissions landscape. In 2024, container shipping emissions jumped by 14%, reaching 240.6 million tonnes and surpassing the previous peak of 218.5 Mt in 2021.
Europe has been hit especially hard. Without the Red Sea crisis, EU-related emissions would have landed around 34.7 million tonnes. Instead, 2024 emissions are expected to reach 52.7 million tonnes, a 1.33x increase.
This surge is fueled by longer distances and declining schedule reliability. Cargo distances have grown up to 53%, while global on-time performance dropped from 62% in November 2023 to 52% by January 2024.
Corporate Scope 3 Emissions Under Pressure
Most of these additional emissions fall under Scope 3, the indirect emissions that occur across supply chains and distribution. For most companies, Scope 3 accounts for the largest share of total emissions and is notoriously difficult to track or control.
A Reuters analysis revealed that 10 of 30 major corporations recorded year-on-year increases in Scope 3 emissions between 2022 and 2023. These surges compromise ESG targets, raise red flags with investors, and risk companies’ eligibility for green finance and emissions-linked incentives.
Real-World Corporate Responses
Global brands are beginning to take note. PepsiCo reiterated its 2030 and 2040 emissions goals in light of recent data. Arla Foods acknowledged that their emissions “increased 1:1 with shipping costs.”
Nestlé flagged freight-related stress, while other brands opted for costly and carbon-intensive mode shifts. Levi Strauss and Reckitt rerouted cargo via air and truck freight. However, these choices come at a steep environmental cost: trucking emits nearly 10 times more CO₂ than ocean freight per ton-mile, while air freight is up to 47 times more carbon-intensive.
In contrast, Kraft Heinz pursued a different strategy by localizing production. Its Pudliszki factory in Poland now sources tomato paste within 60 km, minimizing emissions from long-distance freight.
Regulatory and Financial Pressures Intensify
Policy responses are also scaling up. EU emissions trading permits have surged approximately 33% due to longer voyages, as 30-day trips become 40-day journeys, the carbon costs increase.
Meanwhile, over 20 countries now support a global maritime emissions tax. If implemented, it could raise over $80 billion annually to fund sustainable fuel research and decarbonization efforts across the sector.
Investor Sentiment and Accountability
The pressure is no longer just regulatory, it’s financial. Nordea Asset Management, one of Europe’s largest ESG investors, has warned companies that repeated Scope 3 failures could lead to divestment.
“Blaming transportation sounds like a cop-out,” said Eric Pedersen of Nordea, underscoring the need for proactive emissions management.
However, market adoption is uneven. As the CEO of Unique Logistics noted, “Major customers are still not asking about CO₂, cost is the main concern.” The gap between sustainability rhetoric and operational reality remains a challenge.
Emissions Seen From Space!
The impact of shipping emissions isn’t just theoretical, it’s visible from space. NASA’s MODIS/Terra imagery from June 4, 2021, captured vast ship trails, cloud formations created by emissions of black soot and particulates.
These trails stretched hundreds of kilometers, a stark visual of the shipping industry’s atmospheric footprint. As rerouting and overcapacity continue to escalate emissions, these visible scars on the sky serve as a powerful reminder: maritime decarbonization can no longer wait.